CLARITY GUI
About the GUI
The CLARITY GUI allows users to insert data into the databse, browse the database, and view the phylogenetic-like tree. Users may view similarities between datasets at various levels of resolution.
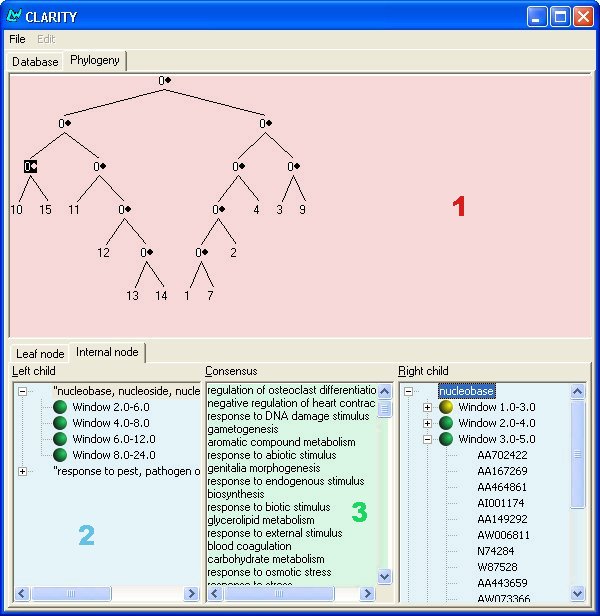
CL-GODB Screenshot

Interface Overview
1. Phylogenetic Tree View
The area below the "Phylogeny" tab is where the tree of data is displayed. A 0 indicates an internal node, which contains a collection of consensus terms. Nodes with numerical values are labelled with the id number of the dataset with which they are associated. Clicking on an internal node will display information in regions 2 and 3 of the above diagram. Clicking on a leaf node will display information in the leaf node tab, which can be selected by clicking.
2. Left and Right Information
These panels, displayed as tree views, contain the terms that are either not in the intersection of the two children of the selected node, or those which are regulated differently. Clicking on each term in these panels will expand the tree and display a number of windows with colored icons. The icons represent the terms overall regulation, or activity, in that window of time. Green denotes a term which is down regulated, red denotes up regulation, and yellow denotes neither. If there is a plus sign next to the window's icon, it means that probe, or gene, information was provided with the data. Clicking on these icons displays the list of genes.
3. Consensus Information
Selecting an internal node fills this list panel. It contains the highly similarly regulated terms of the selected node's two immediate children.
Questions? Queries? Suggestions? Comments? Please direct them at me.
News
News in chronological order, most recent on top.
- 2006-08-16
Updated description.